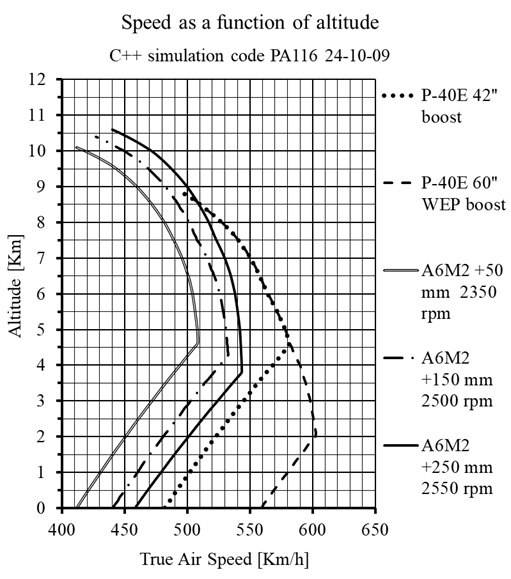
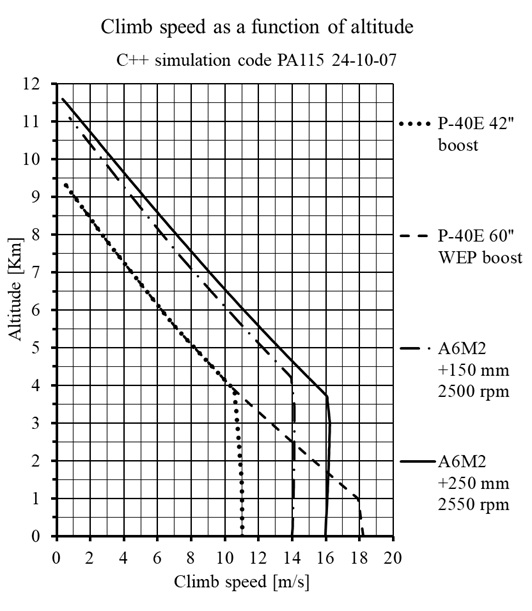
Just as is the case for WW1 aircraft, charts showing speed and climb rate as a function of altitude like the figures below are the very basis upon which to compare two designs, and they are absolutely necessary and can never be replaced by a single number as is unfortunately too often the case in many books, some of which are content to compare two designs simply on the basis of their maximum speeds and climb rates.
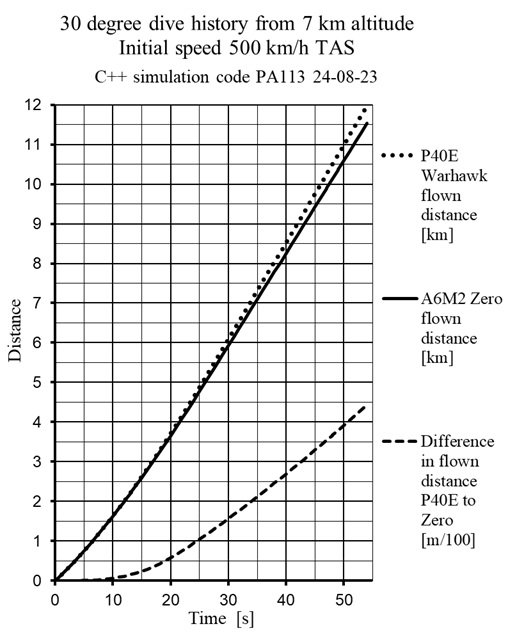
Much the same simulation code and analysis is applicable also when comparing WW2 aircraft as for WW1 aircraft. However, compared to the simulations for WW1 aircraft, where the effects of compressibility can be safely ignored for all but the propeller performance, WW2 aircraft operated at such speeds that both controllability and dive speeds were very much influenced by this factor, therefore it’s necessary to complement these figures with other charts. As an example of why this is so, if we look at the below figure showing the speed and flown distance versus time for the P-40E Warhawk and A6M2 Zero, we can see that in a dive, while both aircraft certainly accelerate without drag having any significant impact until about 10 s into the dive, at this time the drag starts to get progressively larger, and at about 30 s into the dive we can see that both aircraft hit their respective terminal speeds as affected by compressibility.
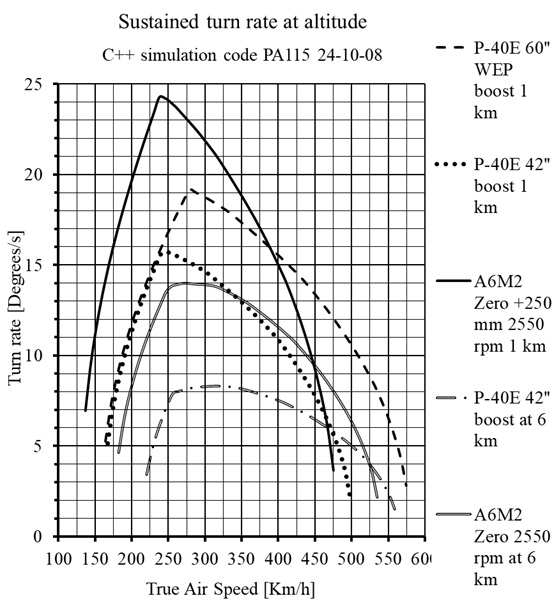
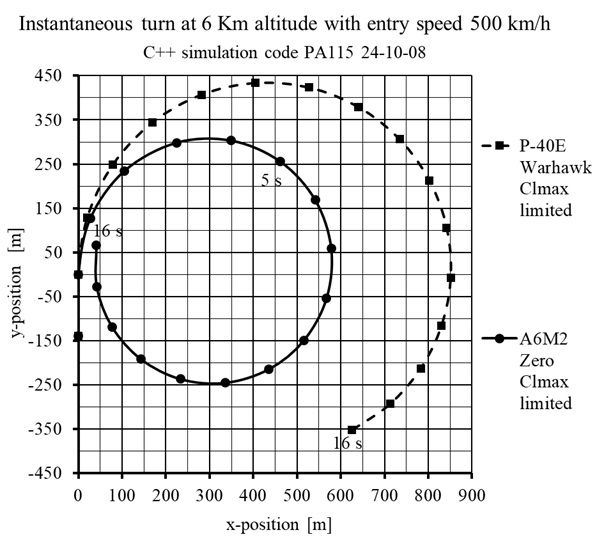
And when it comes to turn performance, the situation is much the same as for speed and climb rate in that there is no single number that can convey how two different aircraft compare on this point and we need to look at both the sustained (as shown in the below chart on the left), and the instantaneous turn performance (depicted on the right) to gauge how aircraft truly compare on this point. In addition, turn rate will of course vary over altitude just as speed and climb rate does, meaning that this also needs to be taken in account when comparing the turn performance.
In summary, aircraft performance needs to be analysed holistically over different height bands and at different speeds since no singular number like top speed, maximum climb rate and turn time can ever hope to capture the whole picture. And sometimes single numbers may even give the wrong impressions when comparing different aircraft given that whatever any particular number suggests, such an apparent advantage is not necessarily static, but may very well vary both with height and speed etc.
This is why the type of simulations done in each one of my books and exemplified above, gives a more complete picture of how two aircraft actually compare, as opposed to a few solitary figures in a table in a book does. For a description of the C++ simulation tool I use, this is described in more detail under the About tab on my hompage.
Finally, for a more complete understanding of what type of simulations and analysis are provided in my books, and what type of conclusions can be drawn from them, my paper comparing the P-40E Warhawk and A6M2 Zero (and from which the above figures are taken), can bedownloaded for free from here.